
Sensitivity Analysis and Monte Carlo Simulation in QUADOA® Optical CAD
QUADOA® Optical CAD offers two complementary tolerance analyses: the sensitivity analysis shows which tolerances affect the performance most, and the Monte Carlo simulation predicts the statistical as-built performance of many randomly perturbed systems. Both evaluate the system with a merit function of your choice. Continuing from defining tolerances, this tutorial runs both analyses and opens the best and worst Monte Carlo systems.
Key points
- Run both analyses from the Simulations group of the Tolerancing tab.
- Both use a merit function as performance criterion.
- Sensitivity: one perturbed system per tolerance, sorted by impact (worst first), for + and − perturbation.
- Monte Carlo: random values from each tolerance’s distribution, for a chosen number of systems.
- Save all, or the best and worst, Monte Carlo systems to analyze them further.
Terms used in this article
- Sensitivity analysis
- Evaluates the effect of each tolerance alone, perturbed by its plus and minus value.
- Monte Carlo simulation
- Evaluates many systems in which all tolerances are applied at once with random values.
- Performance criterion
- The merit function used to rate the perturbed systems.
- As-built performance
- The performance expected from real, manufactured systems.
How to run a sensitivity analysis
- In the Tolerancing tab, click Sensitivity Analysis.
- Select the merit function used as performance criterion and click OK.
The report lists every tolerance with its effect on the merit function, sorted with the worst at the top. For each tolerance it shows the merit function value and its change from the nominal value for a positive and a negative perturbation. In the video, the Z position of lens A3 has the largest impact, with a change of 2.2 for the positive perturbation.
The statistical distribution is ignored here: each tolerance is perturbed by ± its value (or by its limits, or by 3σ for normal-type distributions).
How to run a Monte Carlo simulation
- Click Monte-Carlo Simulation in the Tolerancing tab.
- Enter the number of samples, for example 100, and select the merit function.
- Check the option to save the best and worst system, and click OK.
Each sample applies a random value to every tolerance, drawn from its distribution, and evaluates the system. The report shows the statistics of the merit function over all samples; in the video, sample 51 is the best and sample 78 the worst.
How to analyze the best and worst systems
Saved systems can be opened like any model. In the video, the best and the worst system are opened and their perturbed values are inspected. You can analyze them with all plots, for example to see which combination of errors makes the worst system fail. The Monte Carlo dialog can also save a large number of perturbed systems for further analysis, for example with a Python script.
Which analysis is useful when?
| Sensitivity analysis | Monte Carlo simulation | |
|---|---|---|
| Question answered | Which tolerances are critical? | How will the built systems perform? |
| Perturbation | One tolerance at a time, ±value | All tolerances at once, random |
| Uses distribution | No | Yes |
| Output | Ranked list of tolerances | Statistics, best and worst systems |
If alignment steps such as refocusing are part of the assembly process, model them with compensators; both analyses then include the compensation. For a fast, built-in estimate during design, the Tolerancing Sensitivity optimization goal can include tolerance sensitivity directly in the merit function.
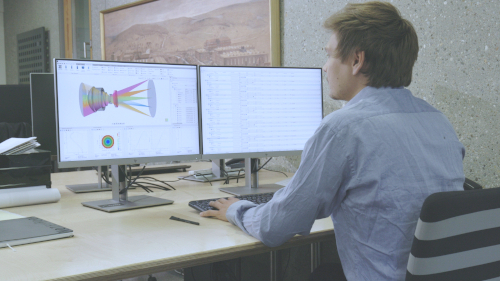
Video tutorial: sensitivity analysis and Monte Carlo simulation
This 3-minute video runs a sensitivity analysis and a Monte Carlo simulation with 100 samples.
Video length: 2:39 min · Also on YouTube: Sensitivity Analysis and Monte Carlo Tolerance Simulation in QUADOA® Optical CAD
Frequently asked questions
The sensitivity analysis perturbs one tolerance at a time by ± its value and ranks the tolerances by impact. The Monte Carlo simulation applies all tolerances at once with random values and gives the statistical as-built performance.
The one you select as performance criterion in the dialog. It can be the design merit function or a dedicated merit function for tolerancing.
Enough for stable statistics; the video uses 100 samples. More samples give more reliable statistics but take longer.
Yes. Save the best and worst system, or all systems, and open them like any model to analyze them.