
How to Add Measurement and FEM Data to a Surface in QUADOA® Optical CAD
QUADOA® Optical CAD can add measured or simulated surface deformations to a surface, for example interferometric measurements or the result of a mechanical FEM simulation. The data is imported, optionally scaled, and fitted with a surface form such as Zernike polynomials, which is stacked on the surface. In the video, a deformation with trefoil error is added and its effect becomes visible in the point spread function.
Key points
- Use right-click on the surface → Add Form and choose an import type.
- Import Dat reads interferometric ZYGO files; Point Cloud Data reads FEM results.
- A point cloud can be a simple semicolon-separated text file with x, y, z coordinates.
- Scale the data (for example Z-scale) and fit it with a form such as Zernike polynomials.
- The fitted deformation is added to the surface and affects all analyses, such as the PSF.
Terms used in this article
- FEM
- Finite element method, used for example to simulate the deformation of a mirror under mechanical or thermal load.
- Point cloud
- A list of x, y, z coordinates describing a surface or its deformation.
- ZYGO .dat file
- A data format of interferometric surface measurements.
- Zernike polynomials
- Orthogonal polynomials on a circular aperture, commonly used to describe surface and wavefront errors.
How to import measurement or FEM data
- Select the surface, for example surface 1, right-click and choose Add Form.
- At the bottom of the list, choose the import type:
- Import Dat for interferometric ZYGO files,
- Point Cloud Data for data from mechanical stress or FEM analysis software.
- Click Import Data and select the file. In the video, it is a semicolon-separated text file with the x, y, z coordinates of the surface deformation.
How to scale and fit the data
- Optionally scale the data on the left, for example set the Z-scale to 10 to exaggerate the deformation.
- At the bottom, choose the form used for the fit: right-click → Add Form → Zernike.
- Set the norm radius, for example 25 mm as for the existing asphere, and the number of terms, for example 150 Zernike polynomials.
- Right-click → Set All Variable.
- Click Convert. The Zernike form is fitted to the data, and the fitting error is shown on the right.
- Click OK.
What is the result?
Other ways to use measured or simulated data
- Convert or Import Form in the menu bar of the Optical Design Editor also fits a surface form to imported data.
- The Grid form describes a sag directly by a 2D lookup table, with nearest-neighbor, linear or bicubic interpolation.
- For refractive index changes inside a lens, for example thermal lensing from a STOP analysis, the 2D or 3D Grid GRIN profiles import the data into the material; see GRIN material property.
- In the other direction, Export Pointcloud (File tab) writes the sag or phase of a surface to a CSV-style x, y, z file, for example for diamond turning of freeforms.
The fitted Zernike form is added to the surface on top of its existing form, using the Surface Form Stack Ability. It describes the surface error, and all analyses take it into account: in the video, the point spread function changes because of the trefoil error in the data. This links mechanical or thermal FEM simulations with optical performance (structural-thermal-optical, or STOP, analysis).
Video tutorial: adding measurement and FEM data
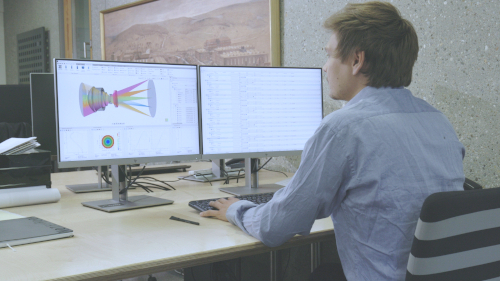
This 2-minute video imports FEM deformation data onto a surface and fits it with Zernike polynomials.
Video length: 2:08 min · Also on YouTube: Adding Measurement and FEM Data in QUADOA® Optical CAD
Frequently asked questions
Yes. Right-click the surface, choose Add Form and Import Dat to load a ZYGO .dat file.
A text file with the x, y, z coordinates of the surface deformation, for example semicolon-separated, imported with Point Cloud Data.
The fit turns the scattered data into a smooth surface description that can be ray traced. You choose the form and number of terms, for example 150 Zernike polynomials, and check the fitting error.
Yes. The fitted form is part of the surface, so all analyses, such as the point spread function, include the surface error.
Yes. Export Pointcloud in the File tab writes the sag or phase of a surface to a CSV-style text file with x, y and z columns.