
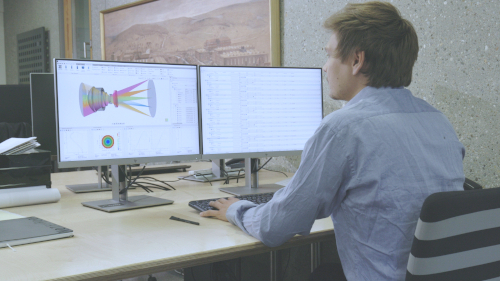


Analysis Plot Settings in QUADOA® Optical CAD
Analysis plots in QUADOA® Optical CAD are opened from the Analysis tab and configured with the settings icon of each plot. There you choose, for example, the sequence, field and wavelength to evaluate. Plots can be rearranged by drag and drop, undocked into separate windows and hidden or shown again in System Setup. The example uses a microscope objective from the examples folder.
Key points
- All analysis plots are in the Analysis tab.
- The settings icon of a plot opens its options, such as sequence, field and wavelength.
- The available settings differ from plot to plot.
- Plots can be moved, undocked and docked again.
- Open plots are listed in System Setup → Plots, where they can be hidden and shown.
Terms used in this article
- Analysis tab
- The tab that contains all analysis plots, such as ray fans, spot diagrams, PSF and MTF.
- Transverse ray fan
- A plot of the transverse ray aberrations over the pupil.
- Docked plot
- A plot placed inside the main QUADOA® window; undocked plots open in their own window.
How to open an analysis plot
Go to the Analysis tab and choose a plot, for example the transverse ray fan. The tab contains the analysis features known from optical design, such as aberration plots, spot diagrams, PSF and MTF.
How to change the settings of a plot
- Click the settings icon of the plot.
- Select what to evaluate, for example the sequence, field or wavelength.
Each plot has its own set of options, so the settings differ from plot to plot. In systems with several configurations, most plots also have a Config setting: Current (the default) always shows the active configuration, or you can fix the plot to one specific configuration.
How to arrange, undock and dock plots
- Move: click a plot with the left mouse button and drag it to a new position.
- Undock: pull a plot out into its own window, for example to place it on a second screen.
- Dock: move it back into the main window.
How to hide and show plots
- Open System Setup. All plots are listed under Plots.
- Right-click a plot and choose Hide.
- To show it again, right-click it and choose Show.
A quicker way: double-click a plot in the Plots list to toggle it between visible and invisible. Invisible plots are grayed out, keep their settings and use no CPU. Reports, such as the ray trace report, are listed and hidden the same way under Reports.
Hiding slow plots also helps performance; see enhancing computing and GUI performance.
Video tutorial: analysis plot settings
This 2-minute video shows the Analysis tab, plot settings and how to arrange, hide and show plots.
Video length: 1:47 min · Also on YouTube: Analysis Plot Settings in QUADOA® Optical CAD
Frequently asked questions
Click the settings icon of the plot and select the sequence, field and wavelength you want to evaluate.
Each analysis has its own parameters, so the options in the settings dialog differ from plot to plot.
Yes. Undock the plot into its own window and move it anywhere; you can dock it back into the main window later.
In System Setup, right-click the plot under Plots and choose Hide, or double-click it. Hidden plots keep their settings and use no CPU.
Yes. Set the Config parameter of the plot to a specific configuration instead of Current.